How to analyse your data effectively
27 April 2022
Tags:
 Manually identifying and predicting trends from scratch is not for the faint-hearted; it is time-consuming, costly, and prone to human error. So, what can we do to avoid these pitfalls?
Data cannot improve safety or quality on its own, it’s what we do with it that adds true value. By standardising your processes, you can be confident that your data trends are accurate and reflect what’s really happening in your organisation; without having to manually collect data to analyse yourself.
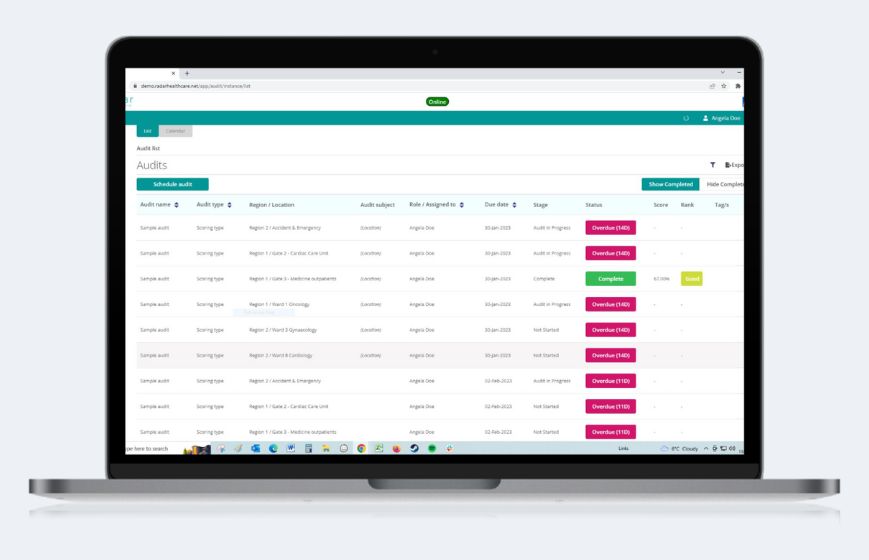
Using an integrated risk management system like Radar Healthcare can not only help you spot themes and understand anomalies with pinpoint accuracy, but it can also save you time and effort by providing a place to collect and store data before engaging with it.
Having a robust system in place to receive, process and analyse data effectively is the first step toward successful data management. But before you get started, here are a few things to consider:
Effective data management
One obvious shortcoming of data analysis is the time it takes to manually collect the huge volume of data generated in a healthcare setting. This is where digital solutions can help.
In Philip’s Future Health Index 2021 report, healthcare leaders cited difficulties with data management (44%) and lack of interoperability and data standards (37%) as the biggest barriers to adoption of digital health technology in their hospital or healthcare facility.
The standard of data is a really important point – to get the most out of any system, you must input accurate information to analyse things effectively. This is where human involvement is still essential to capture that initially so that your risk management system can then do the analysis which will ultimately help your organisation in driving change. The question of interoperability is also an important one – and something which Radar Healthcare works closely with its partners to address. With Somerset NHS Foundation Trust for example we worked together to create a configurable and interoperable solution that met the trust’s requirements and enabled them to continue delivering excellent patient care as well as improving governance – read more in this here.
Empowering your workforce
It’s important that people interact with the data in the system so that they can see where they can improve their own processes and analytic methods. Data analysis is only as good as the data it uses, your workforce must be confident in their ability add the right information to ensure the best possible outcomes.
No organisation is the same, which is why we tailor our software to you and what you are looking to achieve. One of our partners, for example, gradually introduced modules one at a time to ensure users were comfortable with the system, while another implemented a pilot scheme across a number of services prior to the roll-out in over 50 locations. Our project team helps to determine what your organisation needs in terms of data that you can engage with and learn from.
Why move to our system?
We know that analysing data can be difficult, especially when it is separate to the roles that you are primarily doing. With Radar Healthcare, much of the analysing is done for you, so you don’t have to waste time gathering information from a plethora of different data points. You’ll also be confident knowing that our analytics dashboard can be tailored by roles, seniority, and location, giving you a more personalised view of your data.
Our Pulse function also notifies you when something exceeds or falls below a predetermined threshold, allowing you to make informed decisions about quality improvement. These can be set up for a variety of purposes, such as audit success rates or tracking the number of falls in a specific location. When this occurs, Radar Healthcare will automatically start a workflow to notify people and start action plans.
Not only that, but the analytics dashboard simplifies reporting this analysis to teams and board members. Simply display the dashboard in your meeting and use the graphs, sliders, and other widgets to clearly demonstrate the achievement of your KPIs to the appropriate stakeholders.
Previously it took us 2 weeks to create reports, but now it takes just 2 minutes with Radar Healthcare.
Learn from your data with Radar Healthcare
For more information on how our modules can help with your data processes for improved patient safety, get in touch today.
Book a demo
